
Quote Analytics Dashboard
The dashboard turns quote activity into a quick operational view. Use it to see how requests move through the pipeline, which offers are close to expiry, and where quote volume and value are concentrated.
Open B2B Quotes > Analytics Dashboard.
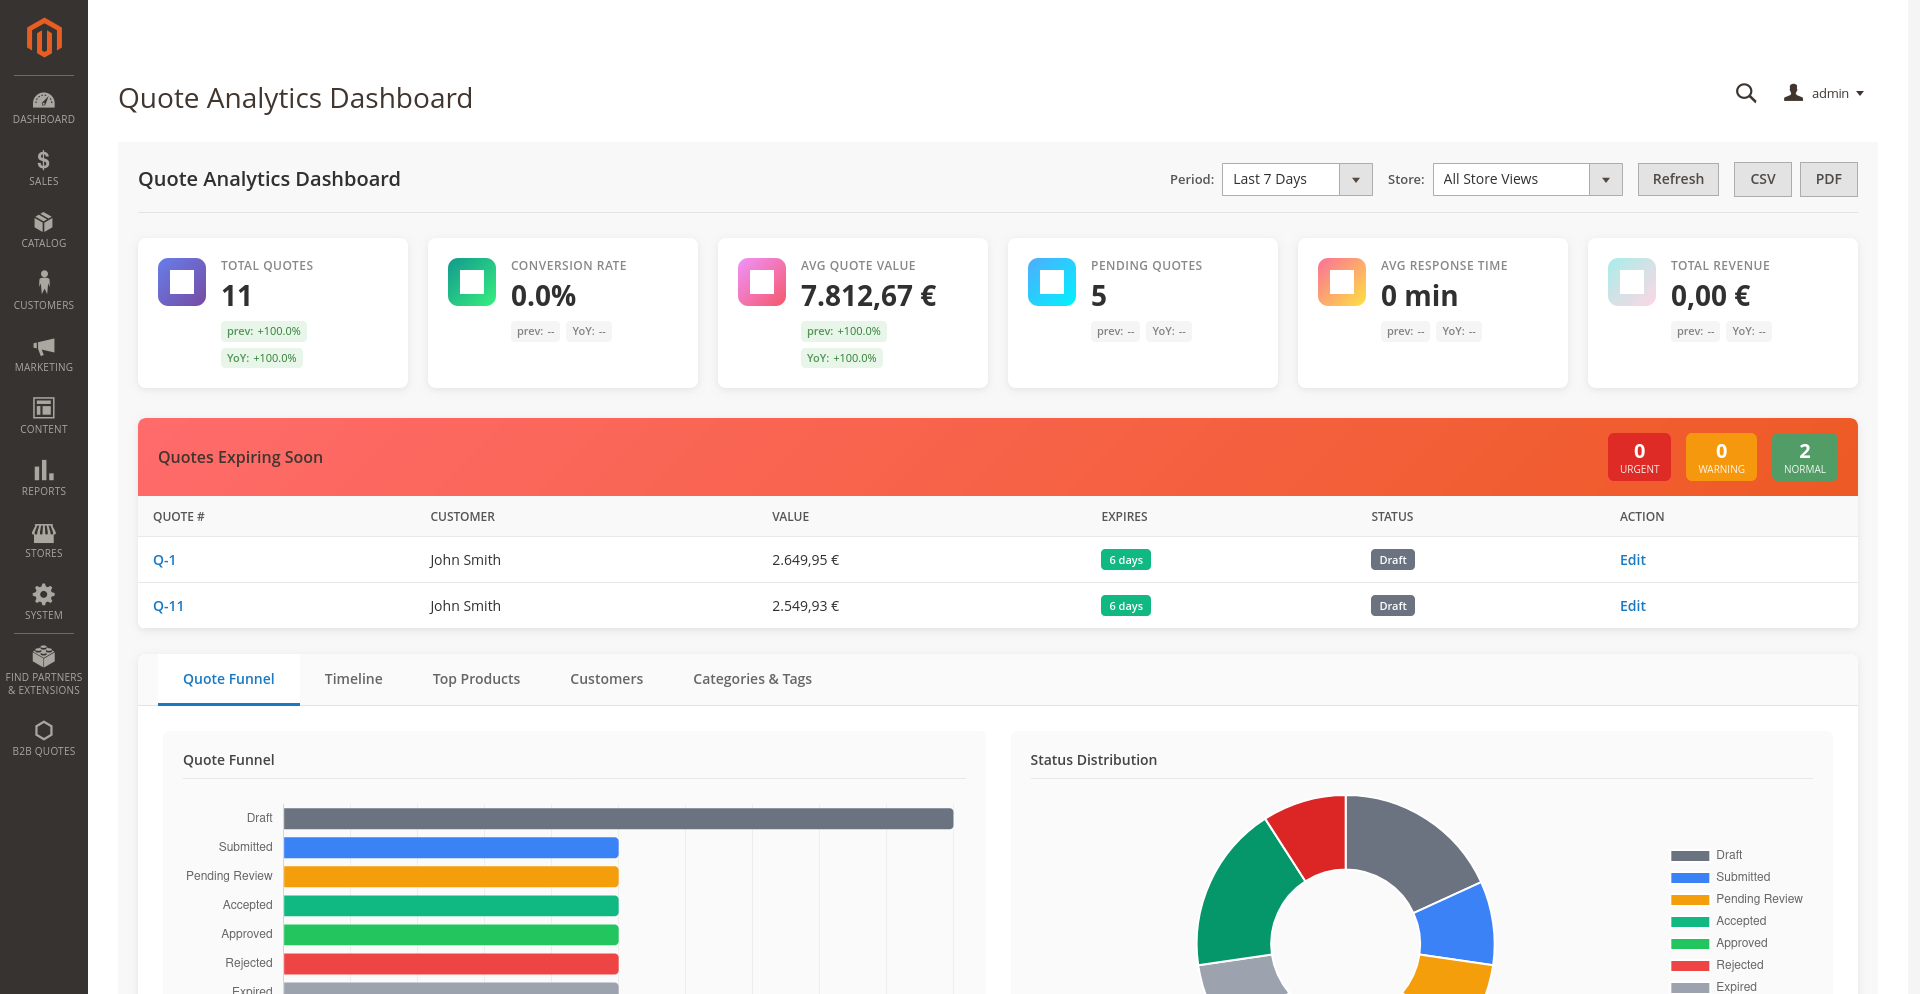
Filter the data first
Choose a period and, when needed, a store view. The dashboard also supports a custom date range. Filters apply to the KPI cards, charts, tables, drill-down results, and exports, so confirm them before comparing figures.
What the dashboard shows
Summary figures
The KPI area summarises quote activity for the selected period. Use it for direction and trend checks, then open the underlying quotes when a number needs investigation.
Quotes expiring soon
The expiry panel groups upcoming expirations into urgent, warning, and later windows covering the next seven days. The list links the date risk back to individual quotes so the sales team can act before an offer lapses.
Funnel and status distribution
The funnel shows quote counts by lifecycle state. Selecting a funnel segment opens a drill-down list with the quote number, customer, value, date, status, and a link to the quote.
Timeline and revenue
The timeline compares created and converted quotes over time and displays the associated revenue trend. Use it to distinguish a change in request volume from a change in conversion.
Products
The product view shows the most frequently quoted products and product conversion rates. It can reveal high-interest products that rarely reach an order.
Customers
The customer view lists top customers and breaks activity down by customer group. This is useful when reviewing account engagement or whether a B2B segment is using the quote channel.
Categories and tags
These charts show category distribution, tag distribution, and quote value by category. Their usefulness depends on consistent category and tag assignment.
Exporting dashboard data
Use Export CSV for further analysis and Export PDF for a shareable snapshot. The export uses the active period and store filter. An administrator needs the separate dashboard export permission.
Permissions
Magento roles can separate access to the dashboard from access to export its data:
MageB2B_B2BQuote::dashboard_view— view dashboard data;MageB2B_B2BQuote::dashboard_export— export CSV or PDF.
See Admin Permissions.
Reading the numbers responsibly
- Compare like-for-like periods and store views.
- Remember that a created quote and a converted quote can fall in different reporting periods.
- Treat low-volume conversion percentages cautiously.
- Keep status, category, and tag usage consistent before using them for management reporting.
- Use drill-down results to validate an unusual chart value instead of assuming the cause.
If a panel is empty
Check the period and store filters first. Then confirm that quotes in that scope contain the data needed by the panel—for example, expiration dates for the expiry list or category/tag assignments for those charts. Finally, verify that the administrator role has dashboard access and inspect the Magento browser console and logs for failed dashboard requests.